

Australia's wages grew 3.3% in the year to March 2026, holding at 0.8% for the quarter, the ABS's latest Wage Price Index confirms [S1, P3]. Private sector pay slipped to 3.2% annually, down from 3.3% a year earlier, while public sector wages pulled ahead [S1, P5]. In the same quarter, new home loans fell 6.2% to 139,794 P⁹. The people most likely to hold a mortgage are the ones whose pay growth is cooling, and the question is what that does to borrowing power next.
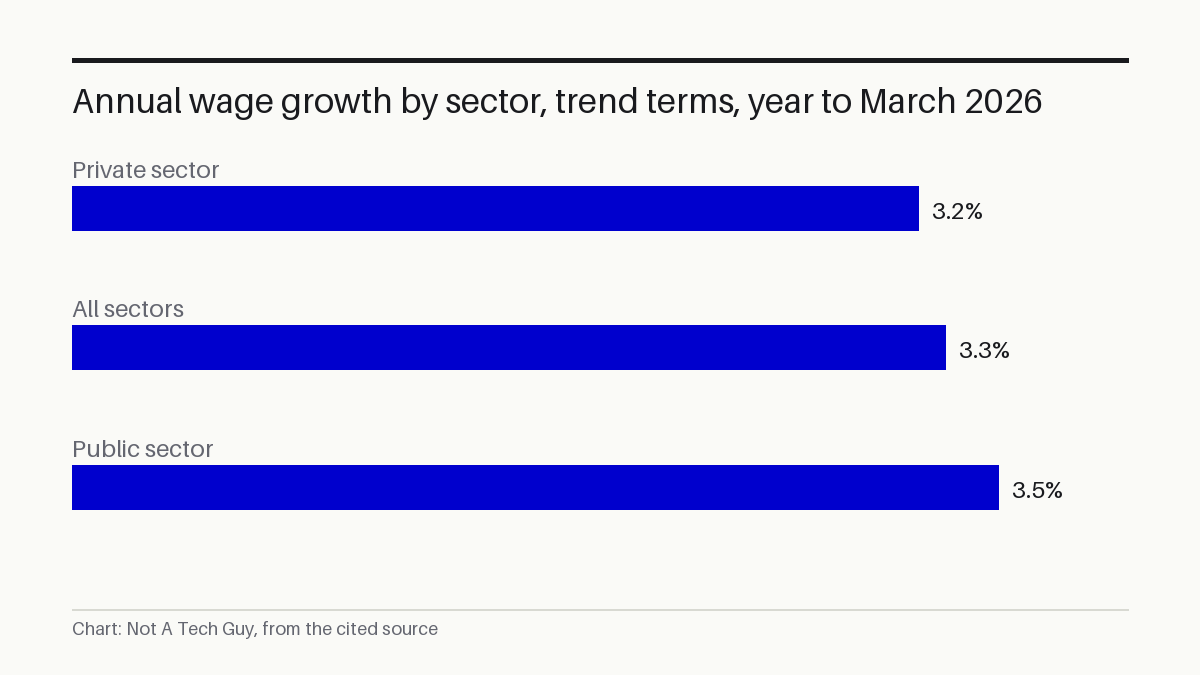
My read: This is the third quarter in a row at 0.8% quarterly growth P⁴, and what strikes me is the split between public and private. Public sector wages are growing faster in trend terms, 3.5% annually versus 3.2% in the private sector S¹. That divergence matters for housing because private sector wages are what most mortgage holders earn. If private pay growth is the one cooling while public sector pay holds up, the people carrying mortgages are getting smaller raises than the people issuing them. I don't buy that this alone tips the market, but combined with the 6.2% fall in new home loans P⁹, the squeeze on borrowers is real and tightening.
Steady on paper, splitting underneath
The seasonally adjusted WPI rose 0.8% in the March quarter and 3.3% over the year [S1, P3]. Quarterly growth has sat at 0.8% since September 2025 P⁴, a rhythm that looks calm from a distance.
The composition is less calm. Private sector wages grew 3.2% over the year, down from 3.3% at the same point in 2025 P⁵. Public sector wages grew 3.3% in seasonally adjusted terms over the same period S¹. In trend terms the gap is wider: public sector annual growth hit 3.5% while private sat at 3.2% S¹.
Why the public-private split matters for housing
Most Australian mortgage holders work in the private sector. Their pay rises feed directly into serviceability, the calculation banks use to test whether a borrower can keep up repayments if rates climb. When private sector wage growth slows, borrowing capacity tightens at the margin.
The ABS released lending data on the same day showing new home loans fell 6.2% to 139,794 in the March quarter P⁹. Wages growth holding at 3.3% coincided with that sharp drop in new lending. The picture now has more detail: the people most likely to borrow, private sector workers, are the ones whose pay growth is easing.
What to do about it
For a mortgage broker in Penrith, this release changes the conversation. A client earning in the private sector may have seen smaller pay rises over the past year than a public sector counterpart on paper, and that affects what the bank's serviceability calculator will approve. The practical step: ask clients for their most recent pay slips along with their annual salary figure, because the quarterly trajectory matters for how lenders assess ongoing income.
For agents and property managers, the 6.2% fall in new home loans P⁹ means fewer financed buyers at auctions. Vendors may need to price for a thinner crowd. For landlords, steady wage growth in the public sector supports rent collection in suburbs with high government employment, but the private sector cooling could soften demand elsewhere.
One thing to check this week: pull the ABS WPI data page and compare the trend private sector annual figure (3.2%) with the seasonally adjusted figure (also 3.2%) S¹. The consistency across series tells you the private sector slowdown is not a statistical quirk.
What we don't know yet
The WPI release contains no inflation data, so we cannot say whether real wages rose or fell. The ABS does not include state or industry breakdowns in this release, so we cannot identify which sectors or regions are driving the private sector slowdown. The release also contains no forward guidance from the RBA or any housing market analysis.
What we need is the June 2026 quarter WPI, scheduled for release on 19 August 2026 P⁶. If private sector annual growth falls below 3.2%, the cooling trend is confirmed. If it holds, the story shifts to whether public sector pay keeps pulling ahead. The next signal: the June 2026 WPI on 19 August. We'll check this claim against it. If this kind of clear read is what you need from the data deluge, subscribe for the next one.
Sources: S1 — ABS Wage Price Index (wages growth) — 2026-Q1 release · P2 — Wage Price Index, Australia, March 2026 · P3 — Wage growth steady in March quarter · P4 — Wage growth steady in March quarter · P5 — Wage growth steady in March quarter · P6 — Wage Price Index, Australia | Australian Bureau of Statistics · P7 — Wage Price Index, Australia | Australian Bureau of Statistics · P8 — Wage Price Index, Australia, March 2026 | Australian Bureau of Statist · P9 — New home loans fall in March quarter | Australian Bureau of Statistics
More from Not A Tech Guy
- Productivity grows, wages lag: Australia's housing squeeze
- Brisbane property market slows as buyers take the wheel
- Three hikes, then a pause: the public data lean HOLD for the RBA’s August decision
Generated from an audited evidence pack with primary-source research. Social-media items are discussion signals, not verified facts. Nothing here is financial, legal or medical advice.