Newer edition: this call has been scored and updated in the September 2026 edition. This page is kept unedited as the preregistered record.
Three hikes, then a pause: the public data lean HOLD for the RBA’s August decision
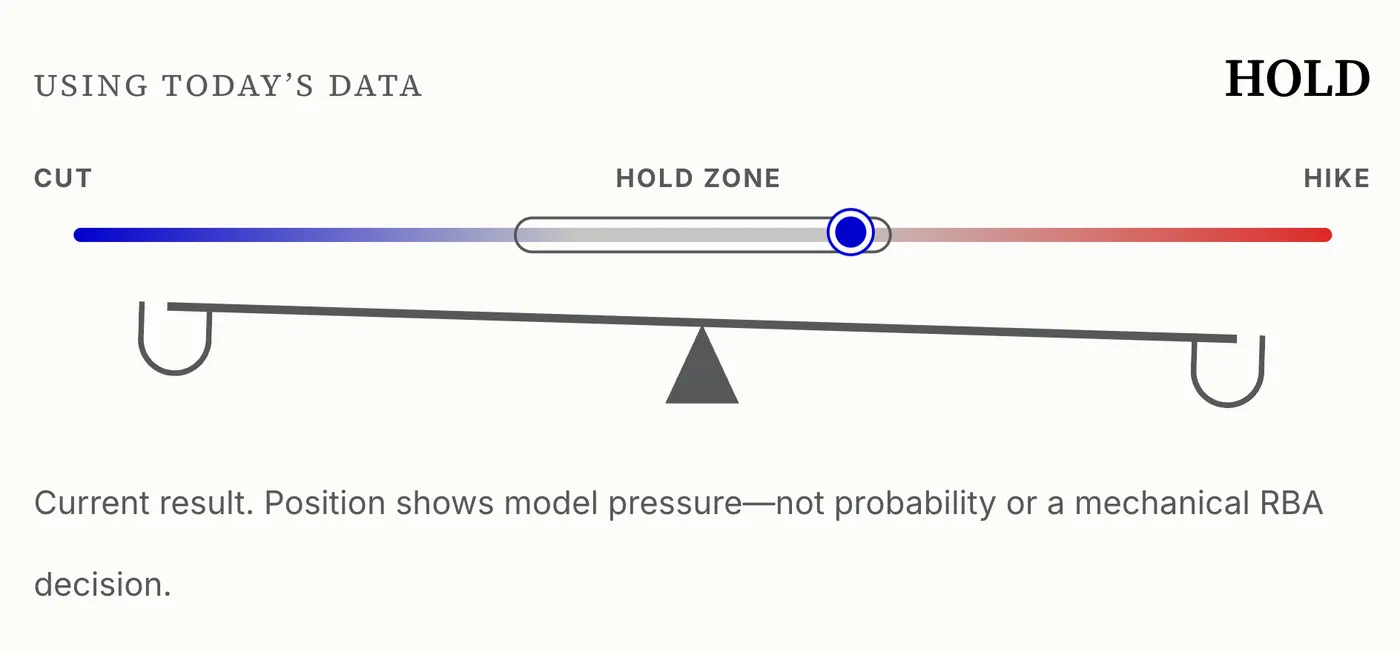
The Reserve Bank raised the cash rate three times between February and May, then paused in June to assess the pass-through of earlier tightening. Our independent ten-driver framework finds the public data still consistent with that pause, though with little margin: inflation and credit keep the balance of risks tilted toward a further increase, while easing inflation momentum and a stronger Australian dollar provide the principal offsets.
The pressure score is approximately +0.25, versus an assumed hike boundary of +0.31. The distance is about 0.06. The boundary is a design choice, not an estimated RBA trigger.
The question we set out to answer
The RBA raised the cash rate three times in the first half of 2026, then paused at 4.35% in June to assess how those increases were flowing through demand and how the global oil shock was affecting inflation. That left a live question for the 10–11 August meeting: has inflation pressure remained strong enough to justify another increase, or is the previous tightening doing enough?
We compile the latest available RBA and ABS observations, record their release dates and source hashes, map ten policy-relevant channels into a common pressure score, and subject the same decision rule to sixteen adverse and benign scenarios. TimesFM is excluded from the decision reading. The result leans HOLD, approximately 0.06 below the framework’s assumed hike boundary.
The exercise is a disciplined organisation of public evidence — not a reconstruction of the confidential RBA staff forecast or the Board’s deliberations.
Inflation is still the central risk
Headline inflation eased to 4.0% in May, while the ABS trimmed-mean measure rose to 3.6%. That combination matters: the headline rate cooled, but underlying inflation remained above the RBA’s 2–3% target band.
View latest 18 plotted periods as table
| Period | Monthly CPI — headline | Monthly CPI — trimmed mean | Persistent-inflation composite |
|---|---|---|---|
| May 2026 | 4.0% | 3.6% | 3.8% |
| Apr 2026 | 4.2% | 3.4% | 3.6% |
| Mar 2026 | 4.6% | 3.3% | 3.6% |
| Feb 2026 | 3.7% | 3.3% | 3.7% |
| Jan 2026 | 3.8% | 3.3% | 3.7% |
| Dec 2025 | 3.8% | 3.3% | 3.7% |
| Nov 2025 | 3.4% | 3.2% | 3.5% |
| Oct 2025 | 3.8% | 3.3% | 3.7% |
| Sep 2025 | 3.6% | 3.2% | 3.5% |
| Aug 2025 | 3.2% | 3.0% | 3.3% |
| Jul 2025 | 3.0% | 3.0% | 3.3% |
| Jun 2025 | 1.9% | 2.8% | 2.9% |
| May 2025 | 2.1% | 3.0% | 3.1% |
| Apr 2025 | 2.4% | 3.2% | 3.4% |
How this reading compares with the market and benchmark rules
No single reading — including ours — should be taken in isolation. Standard practice is triangulation: compare a model-based reading against market pricing and mechanical benchmark rules, and ask whether any disagreement can be explained.
Implied from 30 Day Interbank Cash Rate Futures as of 1 July 2026: 78% no change, 22% a change at the next meeting. This is a genuine market-implied probability (the feed does not separate hike from cut). It currently agrees with our HOLD lean.
A fixed-coefficient Taylor benchmark mechanically prescribes a higher rate while inflation sits this far above target. We report the divergence rather than hide it: the ten-driver framework holds because momentum, expectations and transmission evidence temper the raw inflation gap. Experimental benchmark only.
A directional proxy built from RBA government-bond yields, not an extracted cash-rate path. It sits with HOLD, consistent with the 2-year yield trading close to the cash rate.
Uncalibrated pressure score +0.25 against an assumed +0.31 hike boundary. The score shares behind the benchmark leans above are normalised heuristics, not probabilities; only the ASX row is market-implied.
Market pricing source: ASX RBA Rate Tracker. Benchmark leans are computed by the same pipeline and carry the statuses shown in the data file.
Sixteen scenarios test both sides of the decision
The same weights and thresholds are applied to every stress test: 7 HOLD, 6 HIKE and 3 CUT. The nearest hike state is Domestic activity reacceleration; the nearest cut state is Household balance-sheet squeeze. Each scenario is a deterministic sensitivity, not a probability-weighted forecast; the live baseline beneath the library shows today’s observed state on the same axes for comparison.
Sixteen scenario models, side by side
Every column uses the same ten weights and the same decision thresholds.
- 01+0.30StagflationInflation↑ 4.2%Unemployment↑ 4.9%Wages↑ 4.0%Cash-rate reaction→ 4.35% HOLDCash ratePersistent-inflation compositeUnemploymentWagesLine-end values: current → assumed · dashed = hypothetical endpointHOLD4.35%
- 02+0.05Soft landing on trackInflation↓ 3.3%Unemployment↑ 4.5%Wages↓ 3.2%Cash-rate reaction→ 4.35% HOLDCash ratePersistent-inflation compositeUnemploymentWagesLine-end values: current → assumed · dashed = hypothetical endpointHOLD4.35%
- 03-0.24Disinflation + labour cracksInflation↓ 2.9%Unemployment↑ 4.8%Wages↓ 2.9%Cash-rate reaction→ 4.35% HOLDCash ratePersistent-inflation compositeUnemploymentWagesLine-end values: current → assumed · dashed = hypothetical endpointHOLD4.35%
- 04+0.12High inflation, momentum coolingInflation↑ 4.0%Unemployment→ 4.4%Wages↓ 3.2%Cash-rate reaction→ 4.35% HOLDCash ratePersistent-inflation compositeUnemploymentWagesLine-end values: current → assumed · dashed = hypothetical endpointHOLD4.35%
- 05+0.17False dawn: lower level, hotter momentumInflation↓ 2.9%Unemployment→ 4.3%Wages↑ 3.4%Cash-rate reaction→ 4.35% HOLDCash ratePersistent-inflation compositeUnemploymentWagesLine-end values: current → assumed · dashed = hypothetical endpointHOLD4.35%
- 06+0.02Supply-side disinflation, jobs intactInflation↓ 2.9%Unemployment→ 4.4%Wages↑ 3.4%Cash-rate reaction→ 4.35% HOLDCash ratePersistent-inflation compositeUnemploymentWagesLine-end values: current → assumed · dashed = hypothetical endpointHOLD4.35%
- 07+0.22Inflation sticky, activity weakeningInflation↑ 4.0%Unemployment↑ 4.8%Wages↑ 3.8%Cash-rate reaction→ 4.35% HOLDCash ratePersistent-inflation compositeUnemploymentWagesLine-end values: current → assumed · dashed = hypothetical endpointHOLD4.35%
- 01+0.66Overheating boomInflation↑ 4.0%Unemployment↓ 4.1%Wages↑ 4.4%Cash-rate reaction↑ 4.60% HIKECash ratePersistent-inflation compositeUnemploymentWagesLine-end values: current → assumed · dashed = hypothetical endpointHIKE4.60%
- 02+0.41Oil shock, round twoInflation↑ 4.3%Unemployment↑ 4.5%Wages↑ 3.4%Cash-rate reaction↑ 4.60% HIKECash ratePersistent-inflation compositeUnemploymentWagesLine-end values: current → assumed · dashed = hypothetical endpointHIKE4.60%
- 03+0.49Wage breakout, unemployment steadyInflation→ 3.8%Unemployment↓ 4.3%Wages↑ 4.5%Cash-rate reaction↑ 4.60% HIKECash ratePersistent-inflation compositeUnemploymentWagesLine-end values: current → assumed · dashed = hypothetical endpointHIKE4.60%
- 04+0.36Terms-of-trade boom with domestic spilloverInflation↓ 3.4%Unemployment↓ 4.2%Wages↑ 3.8%Cash-rate reaction↑ 4.60% HIKECash ratePersistent-inflation compositeUnemploymentWagesLine-end values: current → assumed · dashed = hypothetical endpointHIKE4.60%
- 05+0.53Domestic activity reaccelerationInflation↑ 3.9%Unemployment↓ 4.2%Wages↑ 3.9%Cash-rate reaction↑ 4.60% HIKECash ratePersistent-inflation compositeUnemploymentWagesLine-end values: current → assumed · dashed = hypothetical endpointHIKE4.60%
- 06+0.35AUD depreciation shockInflation↑ 3.9%Unemployment↑ 4.5%Wages↑ 3.5%Cash-rate reaction↑ 4.60% HIKECash ratePersistent-inflation compositeUnemploymentWagesLine-end values: current → assumed · dashed = hypothetical endpointHIKE4.60%
- 01-0.52Recession scare / global risk-offInflation↓ 2.4%Unemployment↑ 5.3%Wages↓ 2.2%Cash-rate reaction↓ 4.10% CUTCash ratePersistent-inflation compositeUnemploymentWagesLine-end values: current → assumed · dashed = hypothetical endpointCUT4.10%
- 02-0.35Household balance-sheet squeezeInflation↓ 2.8%Unemployment↑ 4.9%Wages↓ 2.8%Cash-rate reaction↓ 4.10% CUTCash ratePersistent-inflation compositeUnemploymentWagesLine-end values: current → assumed · dashed = hypothetical endpointCUT4.10%
- 03-0.40External slowdown and commodity slumpInflation↓ 2.6%Unemployment↑ 5.0%Wages↓ 2.7%Cash-rate reaction↓ 4.10% CUTCash ratePersistent-inflation compositeUnemploymentWagesLine-end values: current → assumed · dashed = hypothetical endpointCUT4.10%
Reproduction confirms arithmetic and recorded-source integrity only. It does not establish predictive accuracy. These are deterministic sensitivities, not probabilities, causal estimates or an RBA forecast.
The 4.6% comparison is a model assumption, not an official trigger. Source and RBA uncertainty caveat.
Live baseline · ten-driver policy model
Today’s ten inputs, unchanged
Every stress test above changes the displayed macro state and five explicit context drivers, then runs the same weights and hold thresholds used for this baseline.
31/31 source and derivation checks passed
Does the RBA really look at these ten inputs?
Broadly, yes. Mechanically, no. The RBA has no published rule saying these ten variables are required or that they receive fixed weights. Its mandate is price stability and full employment, and staff brief the Board on Australian and global conditions, financial markets, forecasts and risks. The June decision itself discussed inflation, expectations, labour, demand, investment, credit, bond yields, the exchange rate, commodities and global risks.
Inflation level, persistence and expectations
Direct mandate evidenceCentral to the 2–3% inflation objective and the outlook for inflation. Our level, momentum and expectations inputs sit within one 45% inflation block to make the overlap explicit.
Labour market and wages
Direct mandate evidenceRelevant to full employment, capacity pressure and services inflation. Our unemployment-gap input is only a proxy; the RBA uses a broad labour information set and says full employment is not directly observable.
Domestic demand and capacity
Direct outlook evidenceConsumption, investment, GDP and capacity conditions shape the inflation and employment outlook. Our domestic-activity score compresses several releases into one channel.
Credit, market rates and the Australian dollar
Transmission evidenceThe RBA monitors credit availability, bond yields, funding and lending conditions, and the exchange rate. These indicators help assess whether policy is transmitting; none is decisive alone.
Commodities and global risks
Conditioning evidenceEnergy and commodity shocks affect inflation, income and activity. Our commodity input is deliberately small and cannot represent the RBA’s full global forecast.
Forecasts, liaison and Board judgement
Not reproducedThe RBA also uses staff forecasts, business and community liaison, fiscal and public-demand analysis, productivity, detailed lending conditions, asset markets and judgement. These are material omissions from the score.
Assessment based on the RBA’s monetary-policy framework, June 2026 decision, Statement on Monetary Policy process and published description of Board briefings.
Why the framework currently leans hold
The model combines ten policy-relevant drivers using fixed weights that sum to 1.000. The largest hike-side contribution is the level of inflation. Credit growth and domestic activity add smaller amounts of tightening pressure.
These offsets are sufficient to keep the combined score below the hike boundary today; they are not sufficient to eliminate the upside risk to inflation.
What could change the call before 11 August
The decision is conditional on data available by the model lock. Four scheduled releases can update scored or contextual inputs before the meeting:
- Labour Force, AustraliaJune 2026 · labour
- Consumer Price Index, AustraliaJune 2026 · inflation
- International Trade Price Indexes, AustraliaJune 2026 · external context only
- Monthly Household Spending IndicatorJune 2026 · domestic activity / consumption
A stronger inflation or demand print could move the score above the assumed +0.31 boundary. A material deterioration in labour conditions, consumption or external demand could move it toward the assumed -0.31 cut boundary.
Method, reproducibility and limits
The reproduction panel beneath the scenario library is the audit trail: every scenario score recomputes from the published weights, and every input traces to a hash-verified official file. Those checks establish data lineage and arithmetic consistency — they do not establish forecast accuracy, which only the public ledger of meeting outcomes can.
Formally, each driver i is mapped to a bounded score si ∈ [−1, +1] from its official observations, and the composite is the weighted sum S = Σ wi·si with fixed weights that sum to one (inflation block 45%, labour and wages 33%, activity 10%, financial and external conditions 12%). The decision rule is: HIKE if S > +0.31, CUT if S < -0.31, otherwise HOLD. Today S = +0.25.
The framework is not a statistically calibrated probability model or a causal estimate of RBA behaviour. Its weights, transformations and ±0.31 hold band are design assumptions, stated before the outcome and held fixed between meetings. TimesFM is a separate appendix experiment and does not enter this score.
Each driver weight is changed by ±25% and all weights are renormalised. Scores range from 0.21 to 0.28.
The published +0.31 hike boundary is not estimated from historical Board decisions. Alternative boundaries can change the call.
Removing the inflation-momentum offset changes the reading to HIKE; this identifies a decisive modelling choice.
The August call is preregistered, but there is not yet an out-of-sample meeting result. Predictive skill is therefore unestablished.
Where this method sits in the literature
Scoring official data into a policy-pressure reading is a monetary-policy reaction function — a well-studied idea, not an invention of this site. Situating the framework honestly: it is a fixed-weight, preregistered variant of that tradition, far simpler than the models central banks actually run.
- Taylor, J.B. (1993), “Discretion versus policy rules in practice”, Carnegie-Rochester Conference Series on Public Policy — the origin of mechanical benchmark rules; our adapted Taylor comparison descends from this.
- de Brouwer, G. and Gilbert, J. (2005), “Monetary Policy Reaction Functions in Australia”, Economic Record — estimated RBA reaction functions; unlike that work, our weights are asserted, not estimated, which is why we label the score uncalibrated.
- Orphanides, A. (2001), “Monetary Policy Rules Based on Real-Time Data”, American Economic Review — why rules evaluated on final-vintage data flatter themselves; the reason our historical checks are labelled final-vintage and our live ledger starts at zero.
- Ballantyne et al. (2019), “MARTIN Has Its Place: A Macroeconometric Model of the Australian Economy”, RBA RDP 2019-07 — the full-system model the RBA actually maintains; a ten-driver score is not a substitute for it and does not try to be.
- CAMA RBA Shadow Board, Australian National University — the established precedent for publishing independent, before-the-meeting RBA calls and living with the outcomes.
Conclusion: on the current evidence, a hold — conditional on the July data
The most defensible reading of the public evidence on 11 July is that the RBA can hold at 4.35% in August while it assesses the effect of earlier increases. The call is close because inflation remains too high and domestic demand has not weakened decisively. A stronger June inflation or spending result could push this framework into HIKE; a material labour or demand deterioration would strengthen the case for HOLD and eventually CUT.
The reading should therefore be taken as HOLD, with a live upside risk. The contribution of the exercise is not certainty but transparency: every input, assumption, threshold and failure condition is stated before the outcome is known.
Common questions about Australia’s next interest rate decision
When is the next RBA interest rate decision?
The Reserve Bank of Australia announces its next cash rate decision at 2:30pm AEST on Tuesday 11 August 2026, at the end of its 10–11 August Monetary Policy Board meeting, alongside a quarterly Statement on Monetary Policy with updated forecasts.
Will interest rates go up in Australia in August 2026?
Our independent ten-driver framework currently reads the public data as HOLD at 4.35%, about 0.06 below its assumed hike boundary, and ASX cash rate futures priced about a 78% chance of no change as of 1 July 2026. The hike risk is live: a strong June-quarter CPI result on 29 July could change this reading. This is an uncalibrated framework reading, not a guarantee and not financial advice.
What is the current cash rate in Australia?
The RBA cash rate target is 4.35%. It was last raised on 6 May 2026, the third 0.25 percentage point increase of 2026, and the RBA held it unchanged at its June meeting.
What would make the RBA raise interest rates again?
The main upside risks before 11 August are the June Labour Force release (23 July), the June-quarter Consumer Price Index (29 July) and the monthly household spending indicator (4 August). A stronger inflation or demand result in those releases would push this framework's pressure score above its hike boundary.
Could the RBA cut interest rates instead?
A cut looks distant on current data. In our sixteen stress tests, cut outcomes only appear when unemployment rises toward 5% and inflation falls back inside the 2–3% target band — a material deterioration from today's readings. The nearest cut scenario is a household balance-sheet squeeze.
Primary sources
- Reserve Bank of Australia - Cash rate target overview
- Reserve Bank of Australia - Upcoming Monetary Policy Board meeting
- Australian Bureau of Statistics - Consumer Price Index, May 2026
- Australian Bureau of Statistics - Labour Force, May 2026
- Australian Bureau of Statistics - Wage Price Index, March quarter 2026
- Reserve Bank of Australia - Monetary policy objectives and decision process
- Reserve Bank of Australia - June 2026 monetary policy decision
- Reserve Bank of Australia - Statement on Monetary Policy process
- Reserve Bank of Australia - Description of Board briefings, financial conditions and liaison
Publication and correction policy
Status: independent personal research; not commissioned, sponsored or externally peer reviewed. No employer, RBA, ABS or Australian Government affiliation or endorsement is claimed.
Author and contact: published by Not A Tech Guy. Questions, corrections and methodological challenges are welcome: notatechguy@agentmail.to. Substantive challenges that change a published number will be credited in the correction note.
Versioning: this page identifies the observation dates, generation time and model version. Material corrections are made in place with the modified timestamp updated. Historical preregistered meeting calls are retained rather than rewritten after the outcome.
Scheduled review: the reading is provisional until the June labour-force, June CPI and household-spending releases listed above are ingested. The article must be refreshed after those releases before final pre-meeting promotion.