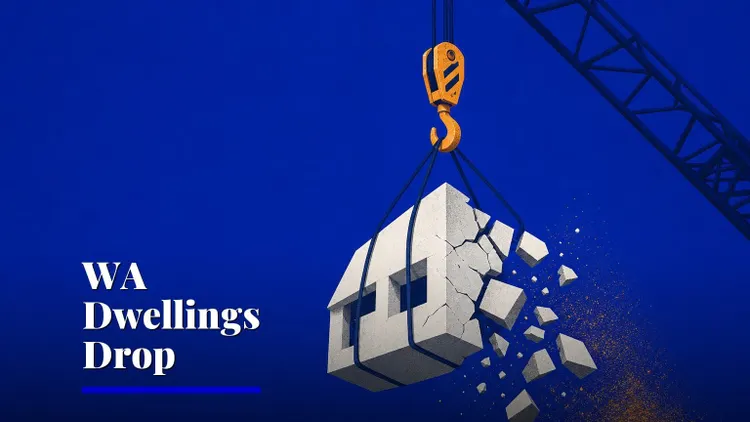

Australian building approvals slipped 1.1 per cent in May 2026 to 17,019 seasonally adjusted dwellings, according to the ABS [S1]. But that single number is hiding a story that matters far more to anyone who builds, buys or rents: the two halves of the housing market are pulling in opposite directions — and the gap is widening fast.
The split that the headline buries
Private sector houses — freestanding homes built by developers and individuals — rose 2.8 per cent month-on-month to 10,537 approvals, and are up 13.2 per cent on a year ago [S1]. That is a strong, sustained acceleration in the part of the market most Australians actually live in.
Private sector dwellings excluding houses — apartments, townhouses and units — fell 10.4 per cent in the month to just 6,034, and are down 8.6 per cent year-on-year [S1]. This is the category that delivers density, affordability and most of the rental supply for inner-city and middle-ring suburbs.
So while the top-line says "down 1.1 per cent," the reality is houses are surging and units are sliding. The ABS's own media release confirms the total fell to 17,019 dwellings in seasonally adjusted terms [P2]. The trend series — which smooths out monthly volatility — tells a milder story: total approvals down just 0.5 per cent, at 17,423 [S1]. But even the trend confirms the divergence, with houses at 10,455 and non-house dwellings at 6,580 [S1].
Why houses and units never move together
Building approvals are the earliest signal in the construction pipeline — they measure local council sign-off, not dirt being turned. A approval today can mean a completed dwelling six to eighteen months later, or never, if financing falls through. The ABS methodology notes cover what is and isn't captured in this count [P4].
The house-versus-unit split reflects two different economic engines. Houses are typically financed by pre-sales or individual buyers with land already secured; they respond to interest rate expectations, land availability and household confidence. Units depend on developer finance — often offshore — presale thresholds, and investor appetite for high-density yield. When credit tightens or presale demand softens, unit pipelines freeze first and fastest.
A 10.4 per cent monthly drop in non-house dwellings, on top of an 8.6 per cent annual decline, suggests that engine is cooling right now [S1]. Houses, by contrast, are running 13.2 per cent ahead of a year ago — a pace that would, if sustained, materially lift detached housing supply [S1].
What it means
For a reader trying to understand why housing feels scarce, this data is the upstream cause. Fewer unit approvals today means fewer apartments reaching the market in 2027 and 2028. Given that units are the primary source of new rental stock in Sydney, Melbourne and Brisbane, a sustained decline in this category tightens rental supply precisely where vacancy rates are already near record lows.
The house surge is good news for the detached-housing shortage — but it is unevenly distributed. Approvals are a national aggregate; they do not tell you whether those 10,537 houses are in greenfield estates on the urban fringe or in the infill lots where demand is most acute.
It is also worth noting that 17,019 total monthly approvals, while up 5.3 per cent year-on-year [S1], is not historically exceptional. The ABS release shows previous peaks above 20,000 and 23,000 during the 2014–2017 apartment boom. Current levels are moderate — a recovery from lows, not a boom.
What it means for business
For builders and developers, the divergence is a strategic fork. Detached housing builders are seeing pipeline growth — the 13.2 per cent annual lift in house approvals [S1] means more work orders, more land releases and more trades demand. Medium-density and high-rise developers face the opposite: a shrinking pipeline, tighter presale requirements and harder finance. A project manager running a townhouse development should be stress-testing presale assumptions against this trend.
For real estate agents, the unit approval decline is a future supply signal. Fewer approvals today means fewer new listings in 18 months — which supports existing unit prices in tight markets, even if sentiment is soft now. House approvals rising means more competition for builders and land, but also more stock eventually reaching the market.
For property managers and landlords, the unit pipeline matters most. If non-house approvals keep falling, the rental supply that typically comes from new apartment completions will thin out in coming years. That is a structural tailwind for rents in already-tight markets — though it is a supply signal, not a prediction.
For mortgage brokers, the house approval strength suggests clients are still committing to build. The question to ask borrowers: has your builder's timeline shifted, and are fixed-price contracts still available given trades demand?
What we don't know yet
The ABS does not tell us why non-house approvals fell so sharply — whether it is developer finance, presale softness, planning delays, or something else entirely. The release provides the count, not the cause [S1].
Monthly seasonally adjusted data is volatile; one month does not make a trend. The trend series — down 0.5 per cent for total dwellings — is the steadier read, but even it does not resolve the house-versus-unit divergence [S1].
We also do not know the geographic split. National approvals can mask very different conditions across states and territories, and this release does not break down the divergence by capital city or region in the data provided.
The next concrete event that will clarify the picture: the ABS releases June 2026 building approvals data on 30 July 2026 at 11:30am AEST [P3]. If non-house dwellings fall again, the cooling pipeline becomes a pattern. If they rebound, May looks like a one-month wobble.
Subscribe to keep reading our coverage of every ABS release, RBA decision and the data that moves Australian property — delivered the moment it drops.
Sources
- [S1] ABS Building Approvals — 2026-05 release — ABS — Building Approvals (primary)
- [P2] Dwelling approvals fall in May | Australian Bureau of Statistics — Dwelling approvals fall in May | Australian Bureau of Statistics (primary)
- [P3] Building Approvals, Australia | Australian Bureau of Statistics — Building Approvals, Australia | Australian Bureau of Statistics (primary)
- [P4] Building Approvals, Australia methodology, May 2026 | Australian Bureau of Statistics — Building Approvals, Australia methodology, May 2026 | Australian Bureau of Statistics (primary)
- [P5] Building Approvals, Australia methodology, April 2026 | Australian Bureau of Statistics — Building Approvals, Australia methodology, April 2026 | Australian Bureau of Statistics (primary)
More from Not A Tech Guy
- Wages growth holds at 3.3% as new home loans fall 6.2%
- RBA warns supply shocks now strike more often
- Sydney home prices drop $31,000 — low-deposit buyers at risk
Generated from an audited evidence pack with primary-source research. Social-media items are discussion signals, not verified facts. Nothing here is financial, legal or medical advice.