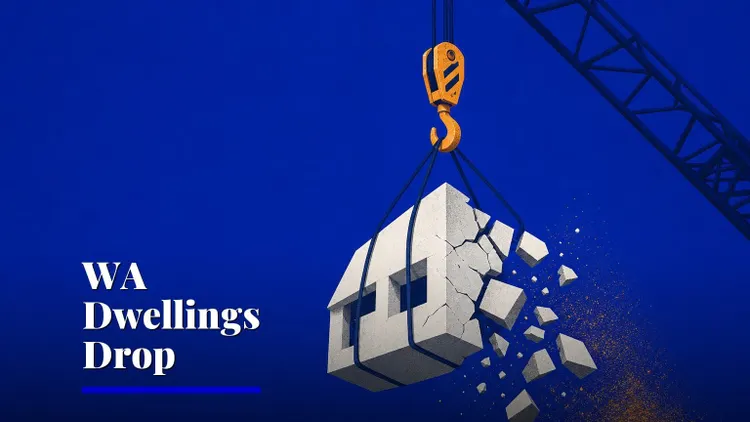

Wages grew 3.3% through the year to March 2026, the ABS confirmed, with quarterly growth of 0.8% — a pace the bureau itself calls "steady" [P3][P5]. On the same day, separate ABS lending data revealed new home loans fell 6.2% to 139,794 in the March quarter [P7]. Pay packets are holding their ground while borrowing steps backwards, and the tension between those two facts is about to reshape decisions for everyone from first-home buyers to landlords. The mechanism that connects them is hiding in plain sight.
The split underneath "steady"
The ABS headline — "Wage growth steady in March quarter" [P4] — papers over a sector divide worth understanding. Seasonally adjusted, private sector wages rose 0.8% in the quarter and 3.2% through the year, while public sector wages rose just 0.5% in the quarter and 3.3% annually on the same basis [S1]. In trend terms — the smoothed series the ABS prefers for reading direction — the picture shifts: public sector annual growth ran at 3.5% versus private at 3.2% [S1]. The takeaway is less about which sector is winning and more about how tight the range is. Both are clustering around 3.2–3.5% annually.
The WPI — the Wage Price Index — measures the cost of labour alone, stripping out changes in who's employed, how many hours they work, or their seniority [P8]. It's the cleanest read on whether your pay packet is genuinely growing or just keeping pace with promotions and overtime. A 3.3% annual figure means the average Australian worker's hourly rate is rising at that pace, regardless of job changes.
The lending signal landing the same week
The same ABS release cycle delivered a second number that matters more for property than the wage figure itself: new home loans fell 6.2% to 139,794 in the March quarter [P7]. Wages holding steady while lending contracts tells you something specific about the transmission mechanism — the chain that links pay packets to property prices.
Here's how that chain works. Your wage growth feeds your borrowing capacity, but not directly. Banks apply a serviceability buffer — a stress-test margin they add to your interest rate — to ensure you could still afford repayments if rates rose. When wages grow at 3.3% but the buffer and prevailing rates stay elevated, the extra income doesn't translate into proportionally more borrowing power. The wage gain gets absorbed by the buffer before it reaches the loan size. So households earn more, feel slightly better, but can't borrow enough more to chase prices higher — and the lending data confirms they're not trying.
What it means
For a renter, steady wages are a double-edged signal. Your pay is growing at 3.3% annually — but without a matching CPI figure in this data release, we can't say whether that's outpacing inflation or falling behind in real terms [S1]. What we can say is that if wages growth is merely steady rather than surging, landlords face the same cost pressures you do, and rents are unlikely to ease from wage pressure alone.
For a first-home buyer, the combination is clarifying. Wages are not falling, which means employment income — the foundation of a mortgage application — remains solid. But lending is falling, which means competition at auctions and open-for-inspections may be thinning. Steady wages plus falling loans is a buyer's-market ingredient, not a seller's.
For an existing mortgage holder, 3.3% annual wage growth is the number to watch against your mortgage rate. If your rate is around 6% and your wages are growing at 3.3%, your repayment burden is easing only slowly — the gap between what you earn and what you owe is narrowing, but not fast.
What it means for business
For mortgage brokers, the WPI print is a conversation starter, not a rate-cut trigger. Clients earning more but borrowing less need help understanding why — and the serviceability buffer is the explanation sitting on your desk. A broker's value this quarter is translating "my pay went up, why can't I borrow more?" into a clear answer about how banks stress-test loans.
For real estate agents, the 6.2% fall in new home loans [P7] is the number to put in front of vendors. It means fewer financed buyers are walking through doors. Pricing strategy should reflect thinner competition, not hold out for a bidding war that the lending data says isn't coming.
For landlords and property managers, steady wages mean tenants' capacity to pay rent is holding — but not accelerating. Rent reviews should be calibrated to costs (insurance, rates, maintenance) rather than assuming tenants can absorb large increases. The wage data says the income side is stable, not surging.
For builders, the lending fall is a leading indicator. Fewer new loans today means fewer construction starts in coming quarters. Pipeline planning should account for a softer demand environment, even as wage growth keeps employed households solvent.
What we don't know yet
The evidence pack has deliberate gaps. There's no CPI inflation figure in this release, so we cannot calculate whether real wages — pay growth minus inflation — rose or fell in the March quarter [S1]. The ABS separately noted that CPI weights will next be updated for January 2027, with release scheduled for 24 February 2027, and from that month CPI will publish on the fourth Wednesday rather than the final Wednesday of each month [S2]. The bureau determined that moving the release earlier would not affect data quality [S2].
We also can't say whether wages growth is accelerating or decelerating, because the prior quarter's WPI figures aren't in the supplied data. The ABS headline calls growth "steady" [P4], but without the December 2025 quarter number, we can't independently verify the direction of travel.
No RBA commentary is included in the sources, so any link between this WPI print and the next cash rate decision is inference, not evidence. The next WPI release — covering June 2026 — is scheduled for 19 August 2026 [P9]. The next ABS lending indicators print will confirm whether the March quarter's 6.2% fall was a one-quarter dip or the start of a trend. Those two releases, read together, will tell us whether steady wages are stabilising the property market or whether falling loans are pulling it toward a correction.
Subscribe to keep reading — we'll have both numbers the moment they land.
Sources
[S1] ABS — Wage Price Index (wages growth), latest release, abs.gov.au
[S2] ABS — Consumer Price Index (quarterly inflation), latest release, abs.gov.au
[P3] ABS — Wage Price Index, Australia, March 2026 (trend data)
[P4] ABS media release — "Wage growth steady in March quarter"
[P5] ABS media release — "Wage growth steady in March quarter" (seasonally adjusted)
[P7] ABS media release — "New home loans fall in March quarter"
[P8] ABS — Wage Price Index, Australia, March 2026 (methodology)
[P9] ABS — Wage Price Index, future releases schedule
Sources
- [S1] ABS Wage Price Index (wages growth) — 2026-Q1 release — ABS — Wage Price Index (wages growth) (primary)
- [S2] ABS Consumer Price Index (quarterly inflation) — 2026-Q1 release — ABS — Consumer Price Index (quarterly inflation) (primary)
- [P3] Wage Price Index, Australia, March 2026 | Australian Bureau of Statistics — Wage Price Index, Australia, March 2026 | Australian Bureau of Statistics (primary)
- [P4] Wage growth steady in March quarter | Australian Bureau of Statistics — Wage growth steady in March quarter | Australian Bureau of Statistics (primary)
- [P5] Wage growth steady in March quarter | Australian Bureau of Statistics — Wage growth steady in March quarter | Australian Bureau of Statistics (primary)
- [P6] Wage Price Index, Australia | Australian Bureau of Statistics — Wage Price Index, Australia | Australian Bureau of Statistics (primary)
- [P7] New home loans fall in March quarter | Australian Bureau of Statistics — New home loans fall in March quarter | Australian Bureau of Statistics (primary)
- [P8] Wage Price Index, Australia, March 2026 | Australian Bureau of Statistics — Wage Price Index, Australia, March 2026 | Australian Bureau of Statistics (primary)
- [P9] Wage Price Index, Australia | Australian Bureau of Statistics — Wage Price Index, Australia | Australian Bureau of Statistics (primary)
More from Not A Tech Guy
- RBA warns supply shocks now strike more often
- Sydney home prices drop $31,000 — low-deposit buyers at risk
- Sydney and Melbourne property prices falling — HSBC warns worse is coming
Generated from an audited evidence pack with primary-source research. Social-media items are discussion signals, not verified facts. Nothing here is financial, legal or medical advice.