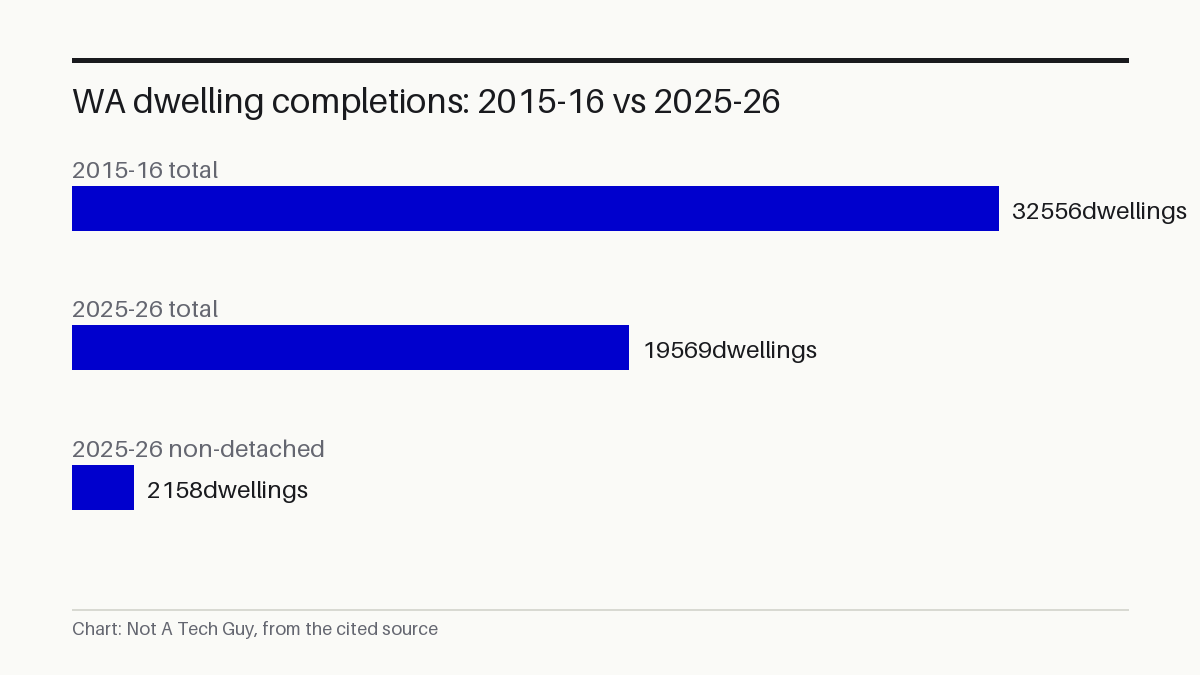
Western Australia completed 19,569 dwellings in the 2025-26 financial year, down 14 per cent on the prior year S¹, according to ABS Building Activity data published on 7 October P³. A decade earlier, in 2015-16, the same state completed 32,556 S¹. Shadow Housing Minister Sandra Brewer called the result appalling: fewer than 20,000 completions in the middle of a housing shortage S¹.
My read: The 14 per cent headline decline is bad enough, but the structural shift underneath it worries me more. Apartments and townhouses, the dense housing that cities need to absorb population growth, have fallen 72 per cent below their 2015-16 level S¹. That is not a cyclical dip. It is a decade-long retreat from the housing type that scales. Brewer's claim that government building work is crowding out private construction is plausible in a tight labour market, but the evidence pack does not prove causation, and no government response is included to test it against.
Dense housing has collapsed to a tenth of total output
The 19,569 completions span every dwelling type, but the mix has shifted hard toward detached houses. Just 2,158 non-detached homes — apartments and townhouses, were finished, making up 11 per cent of all completions S¹.
That category dropped 40 per cent in a single year S¹.
WA has now posted the longest average construction timeframe of any state or territory for five straight years S¹. A house takes 10.2 months from start to finish in WA, compared with the 8.4-month national average S¹. Slower builds mean lower throughput: the same number of tradies and the same pool of materials produces fewer finished homes per year. That is the transmission mechanism from a construction statistic to a housing shortage. Fewer keys handed over means tighter supply, which means the vacancy rate stays low and rents stay high.
Public building surged while private homes fell
Brewer pointed at a specific culprit S¹. Public-sector non-residential building work commenced in WA, excluding infrastructure, jumped 61 per cent from the previous year to an all-time high for the state S¹. She argues that government projects absorb workers, materials and contractors, leaving private home builders to compete with a Treasurer who can outspend almost anyone S¹.
That is a political argument, not a proven causal chain. The ABS data release P³ does not attribute the slowdown to any single factor, and no government minister's response appears in the evidence pack. What is verifiable is that both things happened in the same year: public building hit a record while private home completions fell. Note: the causal link between public-sector building and the decline in private dwelling completions has not been independently tested — no econometric analysis or attribution modelling has been released, and the ABS publication does not isolate contributing factors.
Who feels this on their desk
For a Perth first-home buyer waiting on a house-and-land package, the 10.2-month build time means a contract signed in January might not deliver keys until November, assuming no delays. For a renter, fewer completions mean the vacancy rate stays tight and rents stay high. For a volume builder weighing tender pipelines, the 61 per cent surge in public non-residential work creates a direct desk-level decision: bid for government contracts that pay at scale but tie up crews for months, or hold out for private clients who pay less but offer steadier volume S¹. For a property manager, the supply pipeline drying up means tenant turnover stays painful.
The ABS lending indicators for the June quarter 2026 were released in August P⁴. They offer the next piece of the puzzle: whether finance commitments for new construction are recovering or still falling. The next Building Activity release covers the September 2026 quarter and is scheduled for 13 January 2027 P³.
Sources: S1 — Dwelling Completions Collapse as Housing Crisis Deepens · P2 — Building Activity, Australia, December 2025 | Australian Bureau of Sta · P3 — Building Activity, Australia, June 2026 | Australian Bureau of Statist · P4 — Lending indicators, June Quarter 2026 | Australian Bureau of Statistic
Written from 4 sourced items, 3 of them primary.