

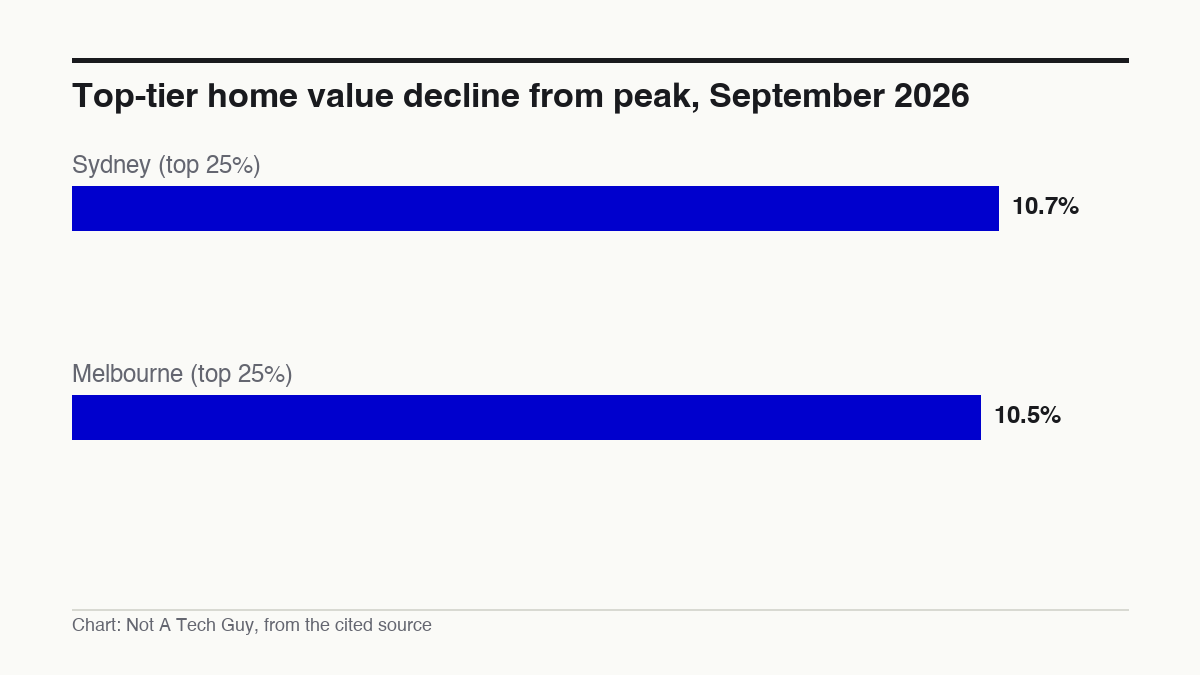
Cotality's September housing charts show the most expensive quarter of Sydney's market has shed 10.7 per cent of its value since peaking, with Melbourne's top tier close behind at 10.5 per cent S¹. The falls are concentrated at the top end, while lower-priced homes and units have held up far better S¹.
My read: This is a top-down correction, not a broad-based crash. The expensive end always moves first and furthest when affordability constraints bite, because the pool of buyers who can afford a $2.1 million purchase shrinks faster than the pool at the entry level. What I'd watch is whether the declines now spreading to Brisbane, Adelaide and Perth stay shallow or deepen. That distinction tells you whether this is a cyclical dip or something structural.
Cotality head of research Gerard Burg says Sydney, Melbourne and Canberra were the first cities to turn and continue to record the largest cumulative falls S¹. More recently, Burg notes, values have also started declining across Brisbane, Adelaide and Perth S¹.
The top of the market carries the weight
The median value of homes in the top 25 per cent sits at $2.1 million in Sydney and $1.2 million in Melbourne, according to Cotality's September charts S¹. A 10.7 per cent fall that leaves the median at $2.1 million implies a peak of about $2.35 million, a paper loss of roughly $250,000. Melbourne's 10.5 per cent fall to $1.2 million implies a loss of about $140,000.
Lower-priced homes and units have shown greater resilience S¹. This is the pattern you would expect when borrowing capacity is the binding constraint: a household stretched to buy at the top has less buffer when costs rise, while entry-level buyers are often insulated by smaller loan sizes and steadier demand.
Lending is contracting alongside prices
The ABS reported on 14 August 2026 that the number of new home loans fell 5.4 per cent to 134,225 in the June quarter 2026 P². The total value of Australia's residential dwellings fell 0.3 per cent to $12.7 trillion in the June quarter, the ABS reported on 8 September 2026 P⁴. Fewer loans being written usually means fewer active buyers, which is consistent with the softer prices Cotality is recording.
Who feels this first
For agents in Sydney's eastern suburbs or Melbourne's inner east, vendor expectations are still calibrated to a market that has moved. Cotality's September figures show the median vendor discount across the capitals widened to 4.2 per cent, the largest since January 2023, and the four-week average auction clearance rate has stayed below 50 per cent since early June C⁵.
For mortgage brokers, the ABS lending contraction means fewer new purchase files. The 5.4 per cent quarterly drop in loan numbers P² leaves brokers who rely on purchase-driven business with thinner pipelines, while refinance work may pick up as owners try to trim costs.
For first-home buyers, the resilience of lower-priced stock means the entry point has barely moved. The downturn gutting top-tier equity is not translating into cheaper starter homes, at least not yet.
For investors holding premium property, the paper losses are real but unrealised. The decision to hold or sell into a falling market turns on serviceability, not sentiment.
The 134,225 new home loans written in the June quarter 2026 P² is the figure brokers and agents will measure the next quarter against.
Sources: S1 — High-end homes leading housing market downturn in Sydney and Melbourne · P2 — New home loans fall 5.4 per cent in June quarter | Australian Bureau o · P3 — Lending indicators, June Quarter 2026 | Australian Bureau of Statistic · P4 — Value of dwellings falls 0.3% | Australian Bureau of Statistics · C5 — High end homes lead market downturn as affordable properties prove resilient | Cotality
Written from 5 sourced items, 3 of them primary.


