

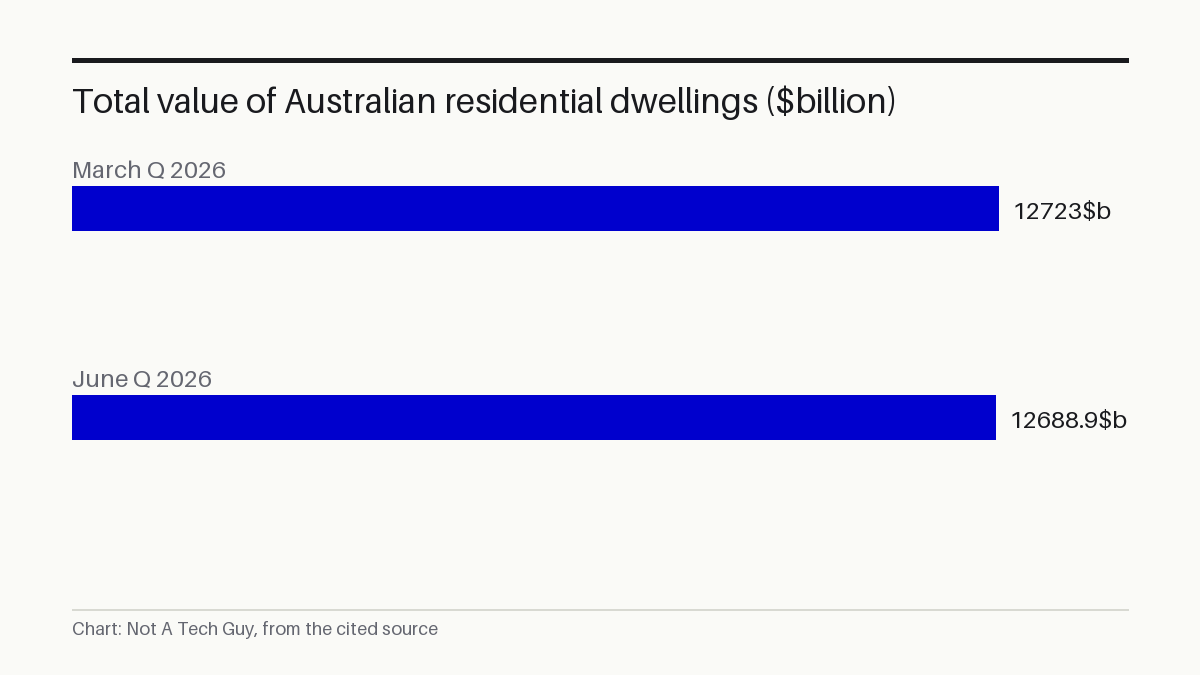
The Australian Bureau of Statistics cut Australia's total residential dwelling value estimate by $34.1 billion in the June quarter 2026, leaving the national housing stock at a preliminary $12,688.9 billion S¹. A typical Australian home shed $8,200 in value, bringing the mean dwelling price to $1,100,400, even as 54,400 new homes entered the stock S¹. The drop is concentrated in New South Wales and Victoria; every other state and territory gained value S¹. The ABS has not released final estimates or confidence intervals for the preliminary total, and the figure is subject to revision.
My read: The national 0.3 per cent fall looks small until you split it by state. NSW alone shed $92.9 billion, more than double Victoria's $44.3 billion loss, and together those two markets dragged the national figure negative while the rest of the country climbed. The September quarter, due 1 December, will show whether the same two-state drag persists or the weakness spreads. The $12,688.9 billion total is a first cut — the ABS routinely revises these estimates once more transaction data arrives.
Two states did the damage
NSW posted the sharpest fall, down 2.0 per cent or $92.9 billion S¹. Victoria lost 1.6 per cent, or $44.3 billion S¹. The ACT slipped 0.7 per cent, shedding $1.4 billion S¹.
Everywhere else, the total value of dwellings rose S¹.
That pattern matters because NSW and Victoria hold the largest shares of Australia's $12.7 trillion housing stock. Together, household owners hold $12,183.3 billion of the total S¹. When the two biggest markets turn down, the national average follows even if Queensland, Western Australia and the rest are still climbing.
For a real estate agent in Sydney or Melbourne, the ABS print confirms what transaction-level data has been signalling: buyers are paying less per home, and the drop is large enough to show up in a quarterly aggregate.
More homes, lower prices
The ABS counted 11,531,100 residential dwellings at the end of June, up 54,400 from the March quarter S¹. More stock and a lower mean price together mean the value decline is driven by price softness, not by fewer homes.
The broader cost backdrop remains hostile for borrowers. The latest CPI reading showed inflation at 4.3 per cent for the year to September 2026, up from 4.0 per cent the month before P⁵. Trimmed mean inflation, the measure the Reserve Bank watches closely, ran at 3.6 per cent P⁵.
Higher inflation keeps the cash rate high, and the cash rate feeds directly into the serviceability buffer — the stress-test margin banks add to your borrowing rate when they calculate how much you can borrow. When that buffer stays high, maximum loan sizes shrink, and that compresses what buyers can offer. That chain runs from the CPI print to the auction clearance rate to the mean price the ABS records the following quarter.
Brokers face tighter serviceability as values slip
A mortgage broker working with a buyer in Sydney or Melbourne can use this release to set expectations: the ABS has now confirmed a quarterly fall in mean dwelling value, and the state-level breakdown shows where the softness sits. For a broker running serviceability calculations, the combination of a falling mean price and a high cash-rate buffer means maximum loan sizes are shrinking on their desk right now — a Sydney buyer who qualified for a given loan last quarter may now find the cap lower even before any price negotiation.
The ABS will release the September quarter 2026 figures on 1 December 2026 P².
Sources: S1 — ABS Total Value of Dwellings (median prices) — 2026-Q2 release · P2 — Total Value of Dwellings | Australian Bureau of Statistics · P3 — Value of dwellings falls 0.3% | Australian Bureau of Statistics · P4 — Total Value of Dwellings methodology, June Quarter 2026 | Australian B · P5 — Price indexes and inflation | Australian Bureau of Statistics
Written from 5 sourced items, 5 of them primary.